Chapter 3 CODEX MAV Part 1
The first step in analyzing CODEX data is to remove image artifacts. Step 1 explains how to open an experiment in CODEX MAV. Step 2 explains how DAPI positive cells are gated to include only those cells with DAPI signal and eliminate cells that were segmented, but do not have DAPI. Akoya Biosciences has provided a data-set with DAPI positive cells gated. We recommend that you use the same gate for DAPI to obtain similar results. If you would like to reproduce the analysis provided by Akoya please skip Step 2 and move to Step 3 to load a gate scheme and begin your analysis.
3.1 Step 1 - Open the CODEX Experiment in CODEX MAV
To open the example data-set in MAV launch Fiji and open CODEX MAV (Figure 1).
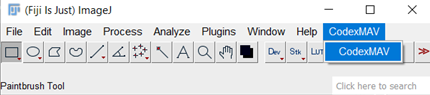
Figure 1. Launch fiji and open CODEX MAV.
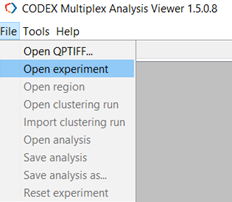
Open the experiment in CODEX MAV by navigating to File->Open Experiment (Figure 2).
Click ‘Select Experiment’ (Figure 3).
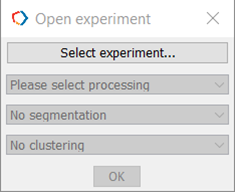
Figure 3. Select Experiment.
This will prompt you to navigate to the experiment folder containing processed data (Figure 4).
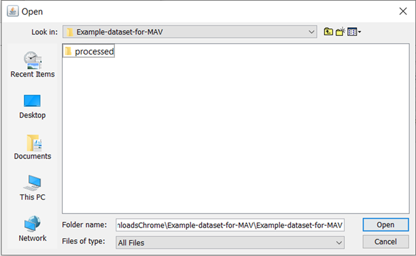
Figure 4. Experiment folder containing processed data.
Open then experiment folder containing processed data by clicking Open. A dialog box will appear prompting you to confirm the experiment settings, please select No Clustering from the drop-down menu (fourth item down) if you have not yet imported the clustering results (Figure 5).
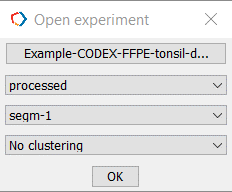
Figure 5. Open experiment with no clustering by selecting OK
If clustering results have been imported, you may select the folder labeled ExperimentName_compensated to load the clustered data.
3.2 Step 2 - Gate DAPI Positive Cells and Remove Artifacts
In the Marker manager, turn on DAPI2 and select DAPI2 on the Marker panel (Figure 6).
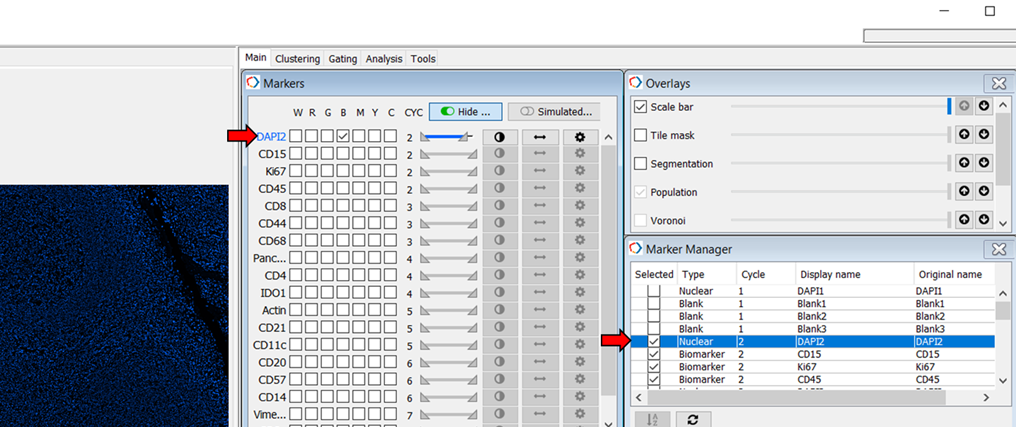
Figure 6. Select nuclear DAPI-2 from the Marker Manager and Markers lists in MAV.
Select Gating->New (all cells, Figure 7).
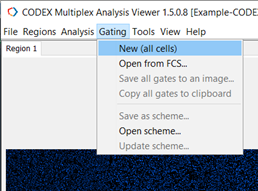
Figure 7. Create a new gate.
In the gating tab set X to Dapi2 and Y to Frequency. Gate cells to include only those cells that contain DAPI. Use the imagery and population overlays to confirm your gating selection. Add to populations (Figure 8).
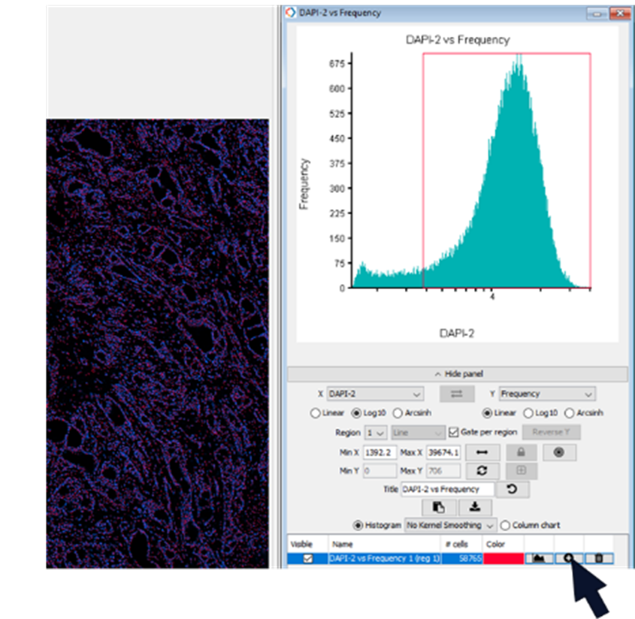
Figure 8. Create a gate selecting DAPI positive cells and add gated cells to a population (black arrow)
Navigate to the main tab and double click to rename the population to Pop 1. To save your gate as a scheme to be opened by another investigator or in another experiment navigate to Gating and click Save as scheme and save the file. In our example, we name the scheme DAPI.json.
3.3 Step 2 (Alternative) - Open Saved Scheme
To open a saved gating scheme, navigate to Gating and select Open Scheme (Figure 9).
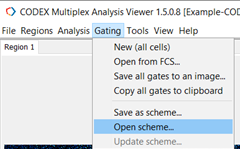
Figure 9. Open a saved gating scheme
Select the scheme saved in the processed folder (the scheme will be a file named DAPI.json) and click open. In Gating tab create a population from the loaded gate as shown in Figure 8.
3.4 Step 3 - Export Single Cell Data
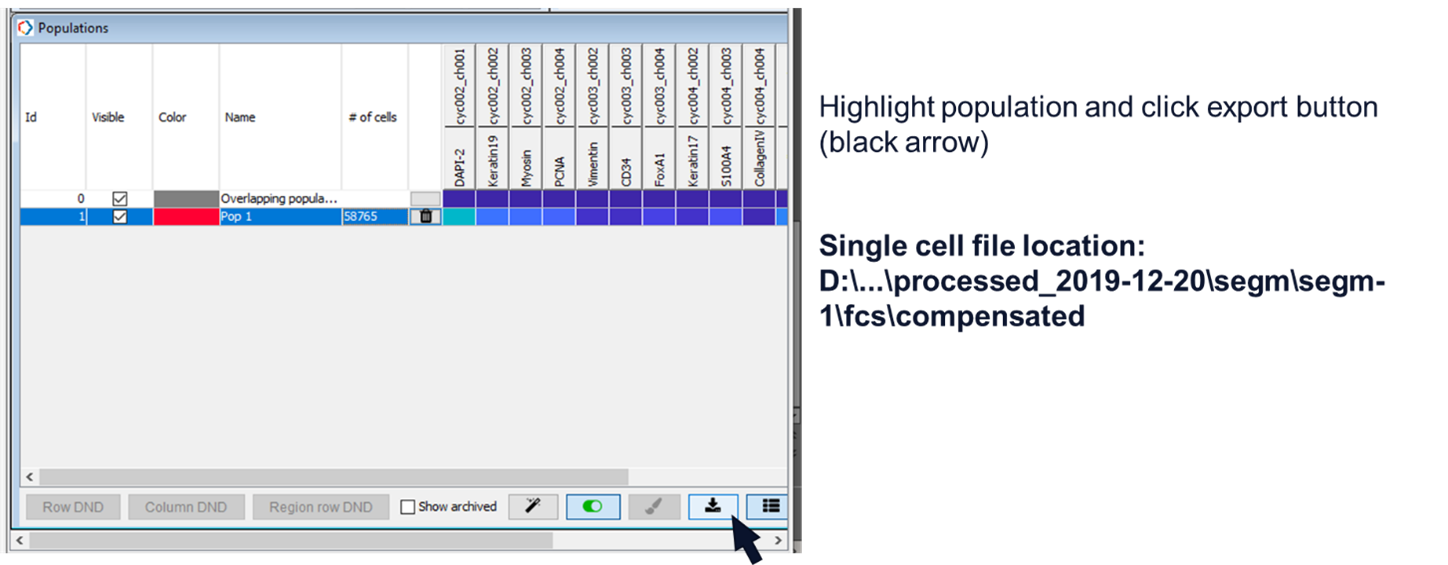
Export the single cell data (Figure 10, black arrow). The single cell data is saved to the ‘experiment/processed/segm/segm-1/fcs/compensated’ folder. You must highlight at least one population in order to export the data.
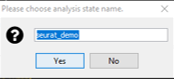
 Specify the analysis state name (Figure 11). You will want to record this name as you will need it later.